 The U.S. employment report for May beat expectations by a wide margin. Not only did payrolls rise against expectations of a substantial decline, the unemployment rate fell and the participation rate went up. This surprisingly positive outcome, which runs contrary to the signal from the timely jobless claims data, was a welcome development. However, one month’s data do not change the underlying landscape of ongoing strains in the labor market. In our view, the risks remain to the downside. Even if job gains continue over coming months, it will take years for levels of employment to recover to pre-crisis levels. In addition, the high number of people who are not in the labor force is something to watch for a signal of a more permanent change to labor force dynamics.
The Good
The details of the report showed payrolls rose by a record 2.509M in May. Job losses in April were revised slightly lower, to 20.687M from 20.537M. The data now show a 1.373M drop in March, nearly double the originally reported 701K decline.
The May number was boosted not only by private goods-producing jobs, but also service-producing jobs. In the latter category, job losses in leisure and hospitality had been particularly steep in April, totaling 7.539M. In May, payrolls in this sector increased 1.239M, reflecting a 1.371M-increase in food services, as a reopening of restaurants and bars saw a flow of people moving into old or new remote jobs. However, job losses in accommodation were ongoing.
The unemployment rate declined to 13.3% from 14.7%. The 0.6% increase in the participation rate to 60.8% reflected an increase in the rate for both men and women.
Measurement Issues Ongoing At BLS
The BLS noted that survey response rates as well as data collection continue to be impacted by the virus. Also, issues relating to the classification of workers who were absent from work due to virus-related business closures were ongoing. According to the BLS, if these workers had been correctly counted as unemployed, the unemployment rate would have been three percentage points higher in May and five percentage points higher in April. Most economic data collection processes have been disrupted by the virus. In addition, a number of government agencies are adjusting their models, attempting to more accurately report the numbers. That introduces another level of uncertainty for anyone trying to get a relatively precise reading on current economic conditions.
Now For the Bad News…
Employment in all major sectors remains significantly below levels seen in February, before the partial and full lockdowns of March and April. The level of payrolls in May was 19.6M below the February reading, and civilian employment was 21.5M lower. The unemployment rate was the second-highest on record, with data going back to 1948. The participation rate was close to readings last seen in 1973. While the May bounce in payrolls was welcome, it barely made a dent in the road to job recovery. Conditions in the labor market remain fragile. Do you have issues with your boss? A qualified employment attorney, such as those at HKM, can assist you in dealing with a variety of labor concerns.
Most job losses that occurred from the shutdowns were temporary, as stores, restaurants and factories closed for a period of about six weeks. With activity resuming in May, the number of temporary layoffs declined by nearly 3M from over 18M in April, but they remain almost 15M above the pre-recession level. The number of permanent job losses rose for a third-straight month in May, by 295K to 2.295M. That is 1M higher than in February. We will be watching these readings for more persistent increases that could signal a deterioration in underlying conditions in the labor market. Just as a comparison, permanent job losses averaged 1.786M in 2007 but peaked at 6.818M in November of 2009.
The May data showed that the number of people “not in the labor force” declined to 102M—accounting for about 37% of the civilian population—but was nearly 6.5M higher than the average in 2019. A subset of people who were “not in the labor force but want a job” decreased by 339K in May but was nearly 4.5M above the February level. To be included in the labor force, an individual should have searched for a job over the last four weeks. According to expert lawyers for employment discrimination, a number of people who were on temporary layoff or expected to get called back were unlikely to have looked for alternate employment. If that was the case, then these numbers should decline as people look for jobs or go back to work. However, persistently high or rising readings could signal more permanent damage to the labor market.
Overall, the longer people remain unemployed, the greater the risk that they will leave the labor force, which could lead to a longer-term structural adjustment in the labor market. Older workers who have lost their jobs are especially vulnerable in the current environment. Some will find it hard to find new jobs that offer the same level of compensation and will stop looking. Others are already taking advantage of early retirement packages being offered by companies in an effort to cut costs. Early retirement is a preferable option to being laid off at a later date without any remuneration.
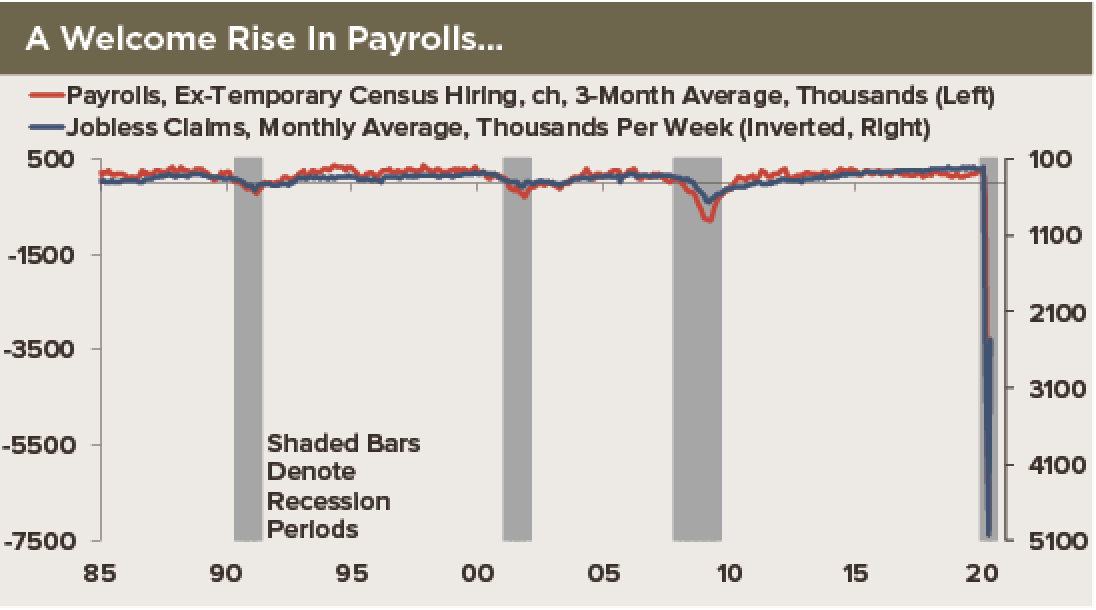
Reconciling Rising Payrolls And Claims Data
If jobs are returning as activity resumes, then the extraordinarily high level of continuing claims, with no sign of consistent declines, is troubling. As a reference, continuing claims for unemployment insurance peaked at around 6.5M just as the Great Recession was ending. It took around five years to get back to pre-recession averages. A sign that the labor market is recovering would come from a decline in the current 21M-plus level in coming weeks, as people continue to move back to employment. However, ongoing high levels would run counter to the argument that most jobs will come back. If a large percentage of workers remain unemployed, that could result in a rethinking of notions of NAIRU over coming years.