
Japan’s sales tax rate is slated to increase in October 2019, to 10% from 8%. Of course, it may not happen. The tax hike has already been postponed once.
Could the Bank of Japan use the jolt to inflation metrics that would follow any sales tax hike to assert that its inflation goal has been achieved, and to back away from monetary stimulus? That is not a very compelling argument.
The last time the government raised the sales tax rate—in April 2014, to 8% from 5%—CPI-based inflation metrics rose by as much as 1.2 percentage points. The pick-up peaked in May, one month after the tax hike was implemented, and then atrophied over the remaining months of the year.
A one-off sales tax hike generates a one-time increase in inflation metrics, but it does not necessarily trigger real inflation. In the quarter before the 2014 sales tax hike, CPI-based inflation metrics were running about 1%. In the fifth quarter after the sales tax hike—after the basis effect had passed out of the calculus—inflation metrics were rising by only half a percent. The slowdown in the underlying inflation rate was the result of the economic slowdown caused by the tax hike.
 Why did headline CPI rise by only 1.2 percentage points after a three-percentage-point hike in the sales tax rate? The ultimate effect of any sales tax hike will be determined by the change in the market equilibrium for consumer goods. To put it more simply, both the supply curve and the demand curve matter in determining how the market price will change and how quantities of goods and services bought will be affected. Our chart illustrates the adjustment.
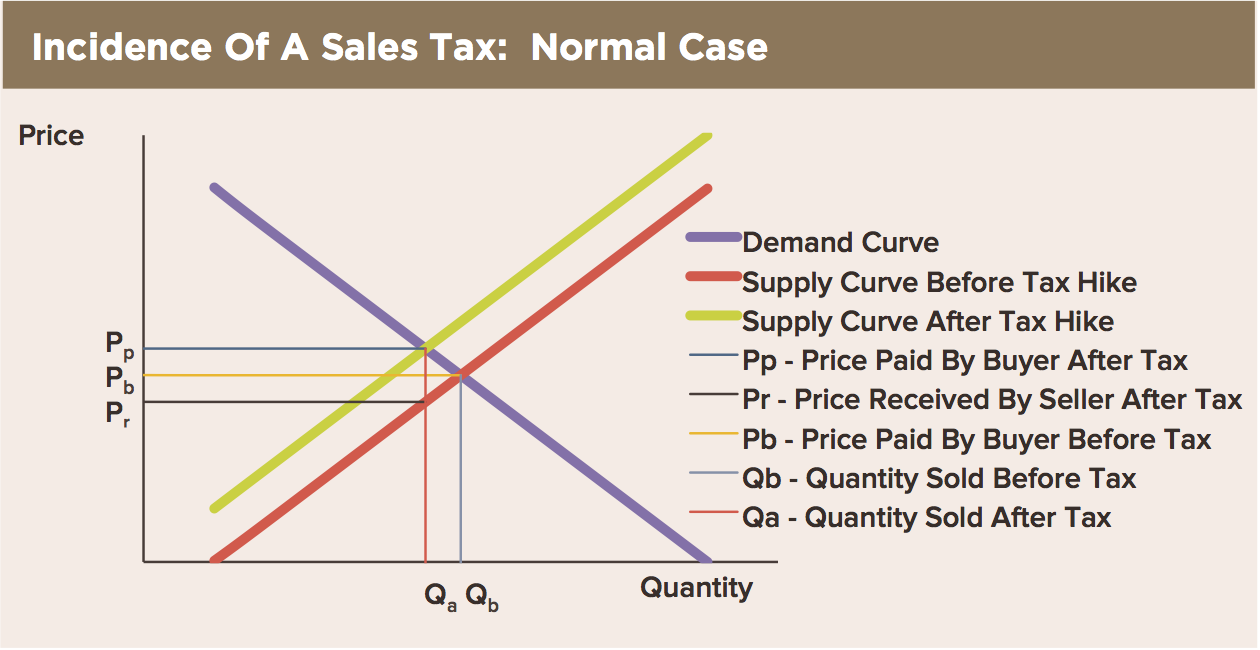
- Only two thirds of the goods in the consumer price bundle are subject to sales tax. Thus, only two points of the three-percentage- point increase in the sales tax rate affected the CPI directly.
- The sales tax hike pushed the aggregate supply curve for goods and services in the economy up by two percentage points. This is drawn on our chart as a vertical but parallel shift: The red supply curve becomes the green one.
- The increase in the market clearing price depends on the slope of the aggregate demand curve, the purple line, which we believe to be minus one—a 45-degree downward sloping line. Why 45 degrees? If you are a consumer, and prices of the goods in your consumption basket rise by ¥1—and your income does not change—then your only choices are to consume ¥1 less or save ¥1 less to supplement the income drop. The aggregate demand curve is drawn assuming all other things—including the saving rate—remain equal. So we put a 45 degree downward slope on the demand curve.
- In this model, a three-percentage-point rise in the sales tax rate leads to a new market equilibrium with consumer prices up by 1% and spending down by 1%, all other things remaining equal.
- The GDP deflator rises by a lot less than the CPI rises. Capital goods—investment—exports and government spending are not affected one bit by a sales tax hike.
If the three-percentage point tax hike in 2014 added one percentage point to inflation metrics, we can predict that a two-percentage-point hike next year would add considerably less. What’s more, any momentum in demand would surely be killed by a tax hike, putting downward pressure on the underlying inflation pulse of the economy.